Your cloud bill arrives every month like a verdict, not a diagnosis. You see the total. Maybe you can squint and tell which cluster costs more than another. But can you answer which workload is burning money? Which deployment version regressed on efficiency? Which container is wasting energy without doing useful work?
If you’re like most Kubernetes teams, the answer is no.
The visibility gap
The tools we have today operate at the wrong level of abstraction:
- AWS Cost Explorer shows EC2 bills. It can’t see inside a pod.
- Kubecost estimates pod-level cost, but it’s based on resource requests — not actual consumption. And it doesn’t track energy at all.
- Prometheus + Grafana gives you raw CPU and memory metrics, but connecting them to cost or energy requires manual work for every single workload.
None of these tools can answer the question that actually matters: “Is this deployment worth what it’s costing me?”
That gap is why we built kubmin.
What is kubmin?
Kubmin is a Kubernetes cost and energy optimization platform that tracks what no other tool tracks — per-workload cost, energy consumption, Running Efficiency, and SCI score, tied to specific deployment versions.
It’s the missing layer between your workloads and your bill.
Six capabilities, one dashboard
-
Per-image-version deep profiling — Point kubmin at a specific image tag and get hourly SCI, energy, CPU, memory, and cost — across that version’s entire lifetime.
-
Release-over-release efficiency diff — Compare any two image versions across CPU, memory, energy, SCI, SEE, and runtime cost. Ship a new release and know within hours whether it regressed.
-
Workload profile classifier — Kubmin automatically classifies each workload as CPU-bound, memory-bound, general, or resource-starved — from runtime behavior, not requests.
-
Smart cluster setup — Spinning up a new cluster? Kubmin filters instance types against your workload profile and shows spec, hourly cost, and embodied carbon for each option.
-
Placement & region recommender — Running on the default instance type in us-east-1? Kubmin surfaces alternatives with similar performance at lower cost and on cleaner grids.
-
Quick wins ranked by savings — Every finding — idle replicas, overprovisioned limits, cheaper instance types, greener regions — becomes a ranked action list with copy-paste kubectl commands.
The Redis example: Three versions, wildly different efficiency
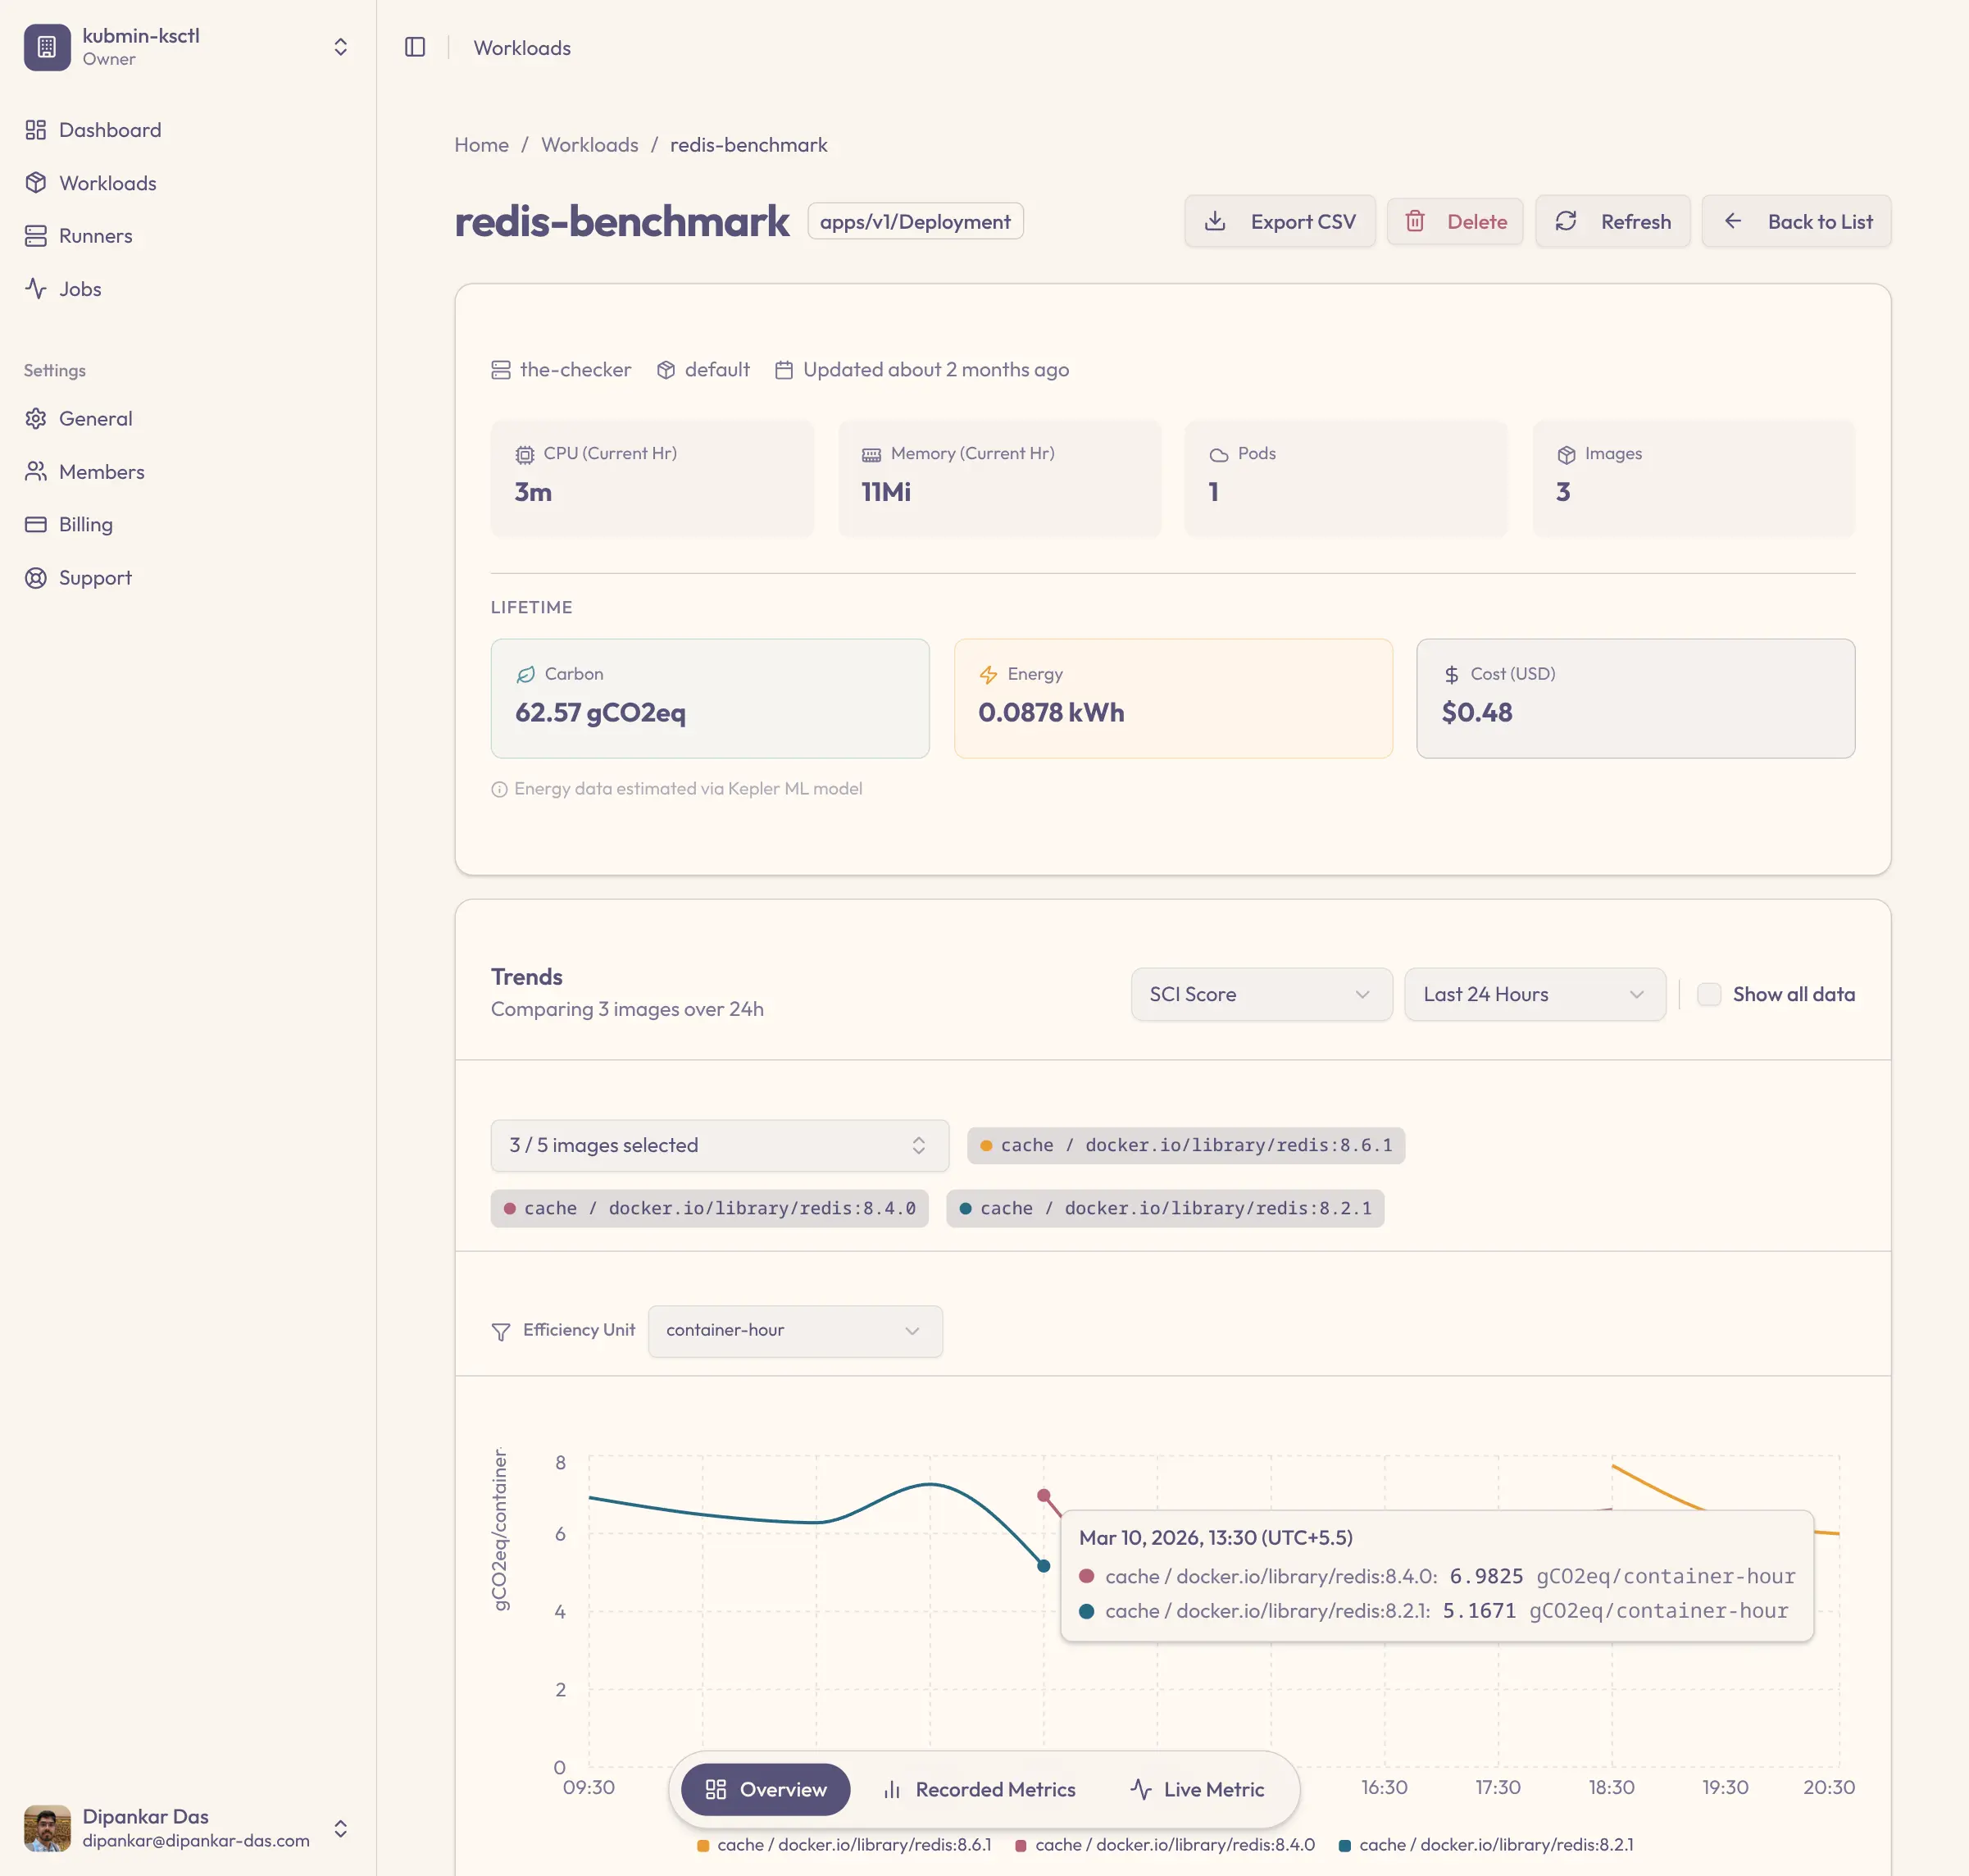
To show what kubmin surfaces, we ran redis-benchmark across versions 8.6.1, 8.4.0, and 8.2.1 on the same hardware. Same workload. Three different versions. Here’s what kubmin found:
| Metric | 8.6.1 | 8.4.0 | 8.2.1 |
|---|---|---|---|
| CPU usage | 149m | 243m (+63%) | 185m |
| Energy/hr | 0.0064 kWh | 0.0085 kWh (+31%) | 0.0072 kWh |
| Cost/hr | $0.0297 | $0.0389 (+31%) | $0.0314 |
| Efficiency (SEE) | Good | Worst | Best |
63% more CPU between versions. 31% more energy. $81/year difference — for one workload on one node.
No single metric tells the full story. 8.4.0 uses the most CPU but isn’t the most expensive. 8.2.1 is most efficient on SEE score but doesn’t cost the least. You need cost, energy, and efficiency together to see the real picture. That’s what kubmin gives you.
Now imagine what kubmin finds across your entire cluster.
How it works
Getting started takes three steps:
-
Sign up at kubmin.ksctl.com and create a cluster — Kubmin provisions Prometheus, Kepler (CNCF project for container-level energy estimation), and the kubmin agent automatically. Nothing to install manually.
-
Label your workloads — Add one label and one annotation to the Deployments, StatefulSets, or DaemonSets you want to monitor. That’s the only configuration.
-
See your results — Kubmin aggregates data hourly and surfaces waste analysis, efficiency grades, cost breakdowns, and Quick Wins automatically.
The metrics that matter
Kubmin uses two key sustainability metrics alongside traditional cost tracking:
SCI (Software Carbon Intensity) — Aligned with the Green Software Foundation specification, SCI tracks the carbon cost of your workloads. It combines energy consumption with regional grid carbon intensity to give you a true carbon picture.
SEE (Software Energy Efficiency) — SEE catches pure efficiency regressions that carbon intensity alone can mask. A workload running in a greener region might show lower SCI but worse efficiency. SEE keeps you honest.
Both metrics, combined with energy trend graphs over time, give you both the financial picture and the sustainability picture in one dashboard.
What’s next
Kubmin is live at kubmin.ksctl.com. The free tier includes one cluster and one workload — enough to connect your test environment and see your first Quick Win.
We’re actively working on:
- Importing existing clusters (not just ones created via ksctl)
- Deeper GitHub Actions integration for CI/CD efficiency gates
- Custom reporting and export for sustainability compliance
Try it free: kubmin.ksctl.com
Join the community: Discord | GitHub
Kubmin is built on Kepler (CNCF project) for energy estimation and the Green Software Foundation SCI specification for carbon tracking. Cluster management powered by ksctl — fully open source.