01
blind spot
No Per-Container Visibility
AWS Cost Explorer shows you EC2 bills. Kubecost estimates pod costs. Neither tells you what a single container actually consumes in energy and compute — the real drivers of your bill.
Everyone ships faster with AI. Nobody checks the cost. Kubmin does.
Per-workload cost and efficiency tracking across deployments. The missing layer between your workloads and your bill.
But do you know what each workload actually costs?
AWS Cost Explorer shows you EC2 bills. Kubecost estimates pod costs. Neither tells you what a single container actually consumes in energy and compute — the real drivers of your bill.
Most teams request 2-4x the resources their workloads actually use. Without per-workload waste detection, you're paying for idle CPU and memory every hour of every day.
You ship a new image version — maybe AI-generated, maybe hand-written. CPU goes up 15%. Memory creeps up. Nobody notices because no tool tracks efficiency changes between deployments. The waste compounds with every release.
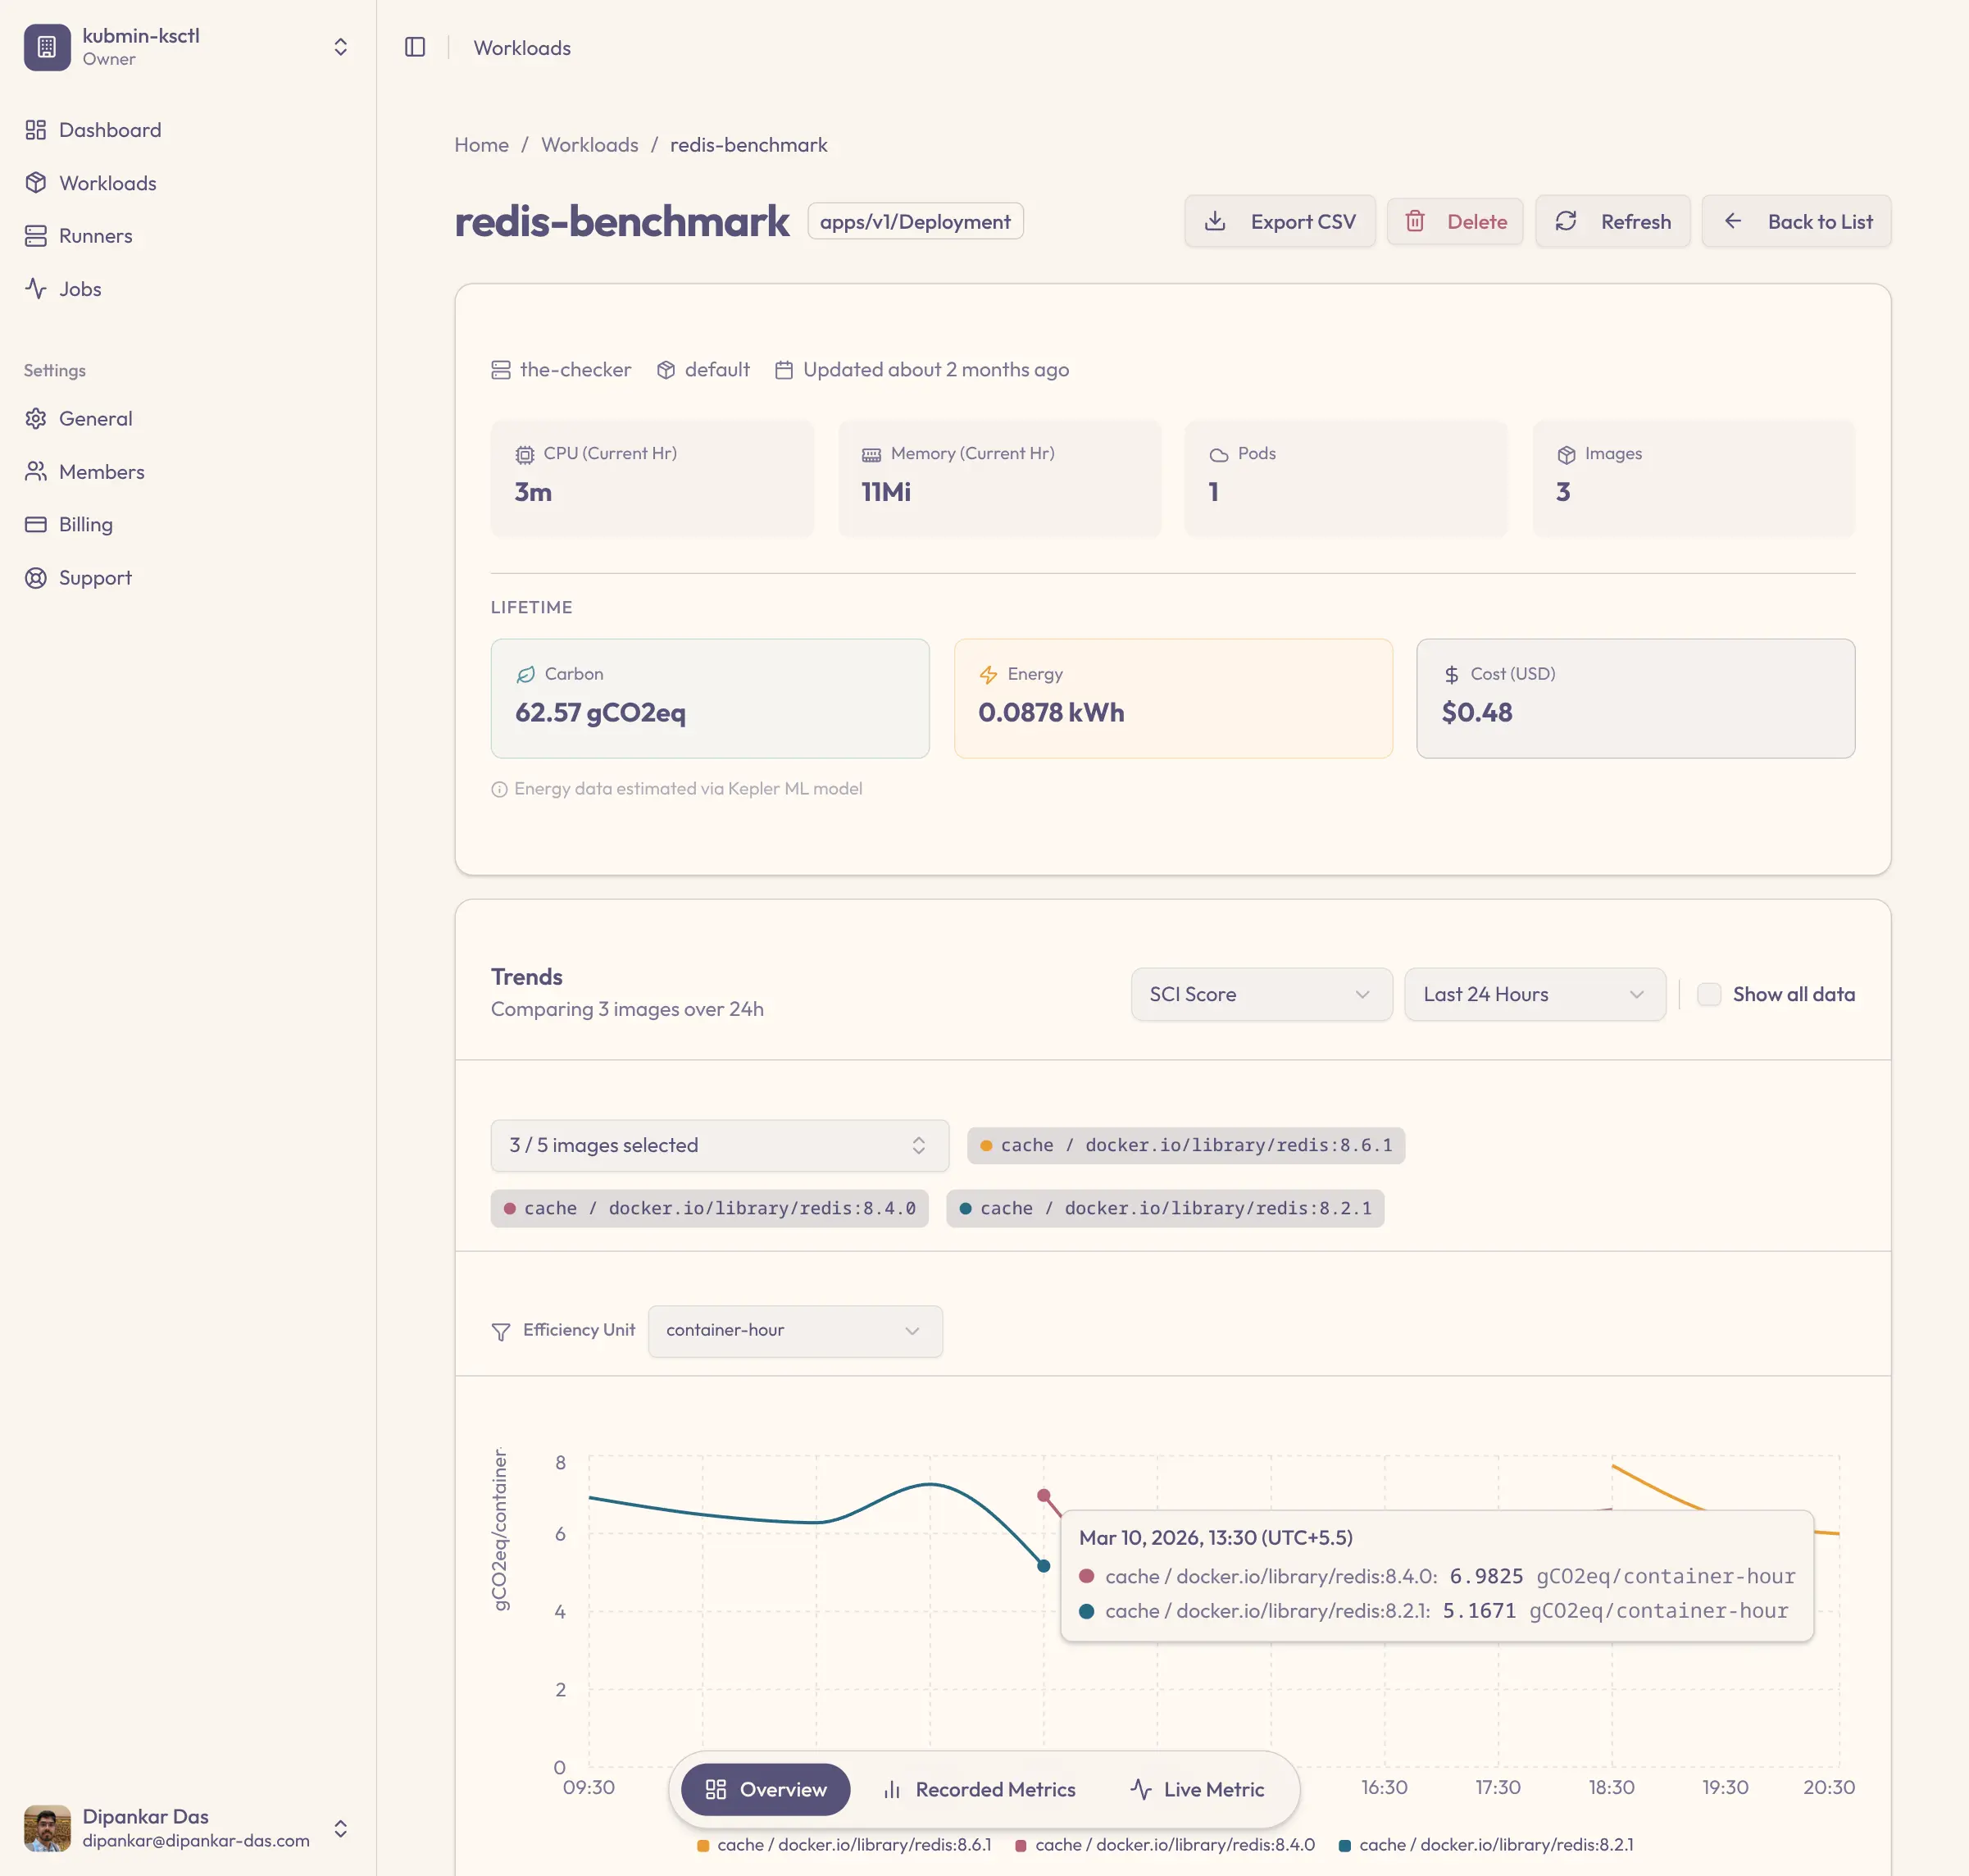
We ran redis-benchmark across versions 8.6.1, 8.4.0, and 8.2.1. Here's what kubmin found — no other tool surfaces this.
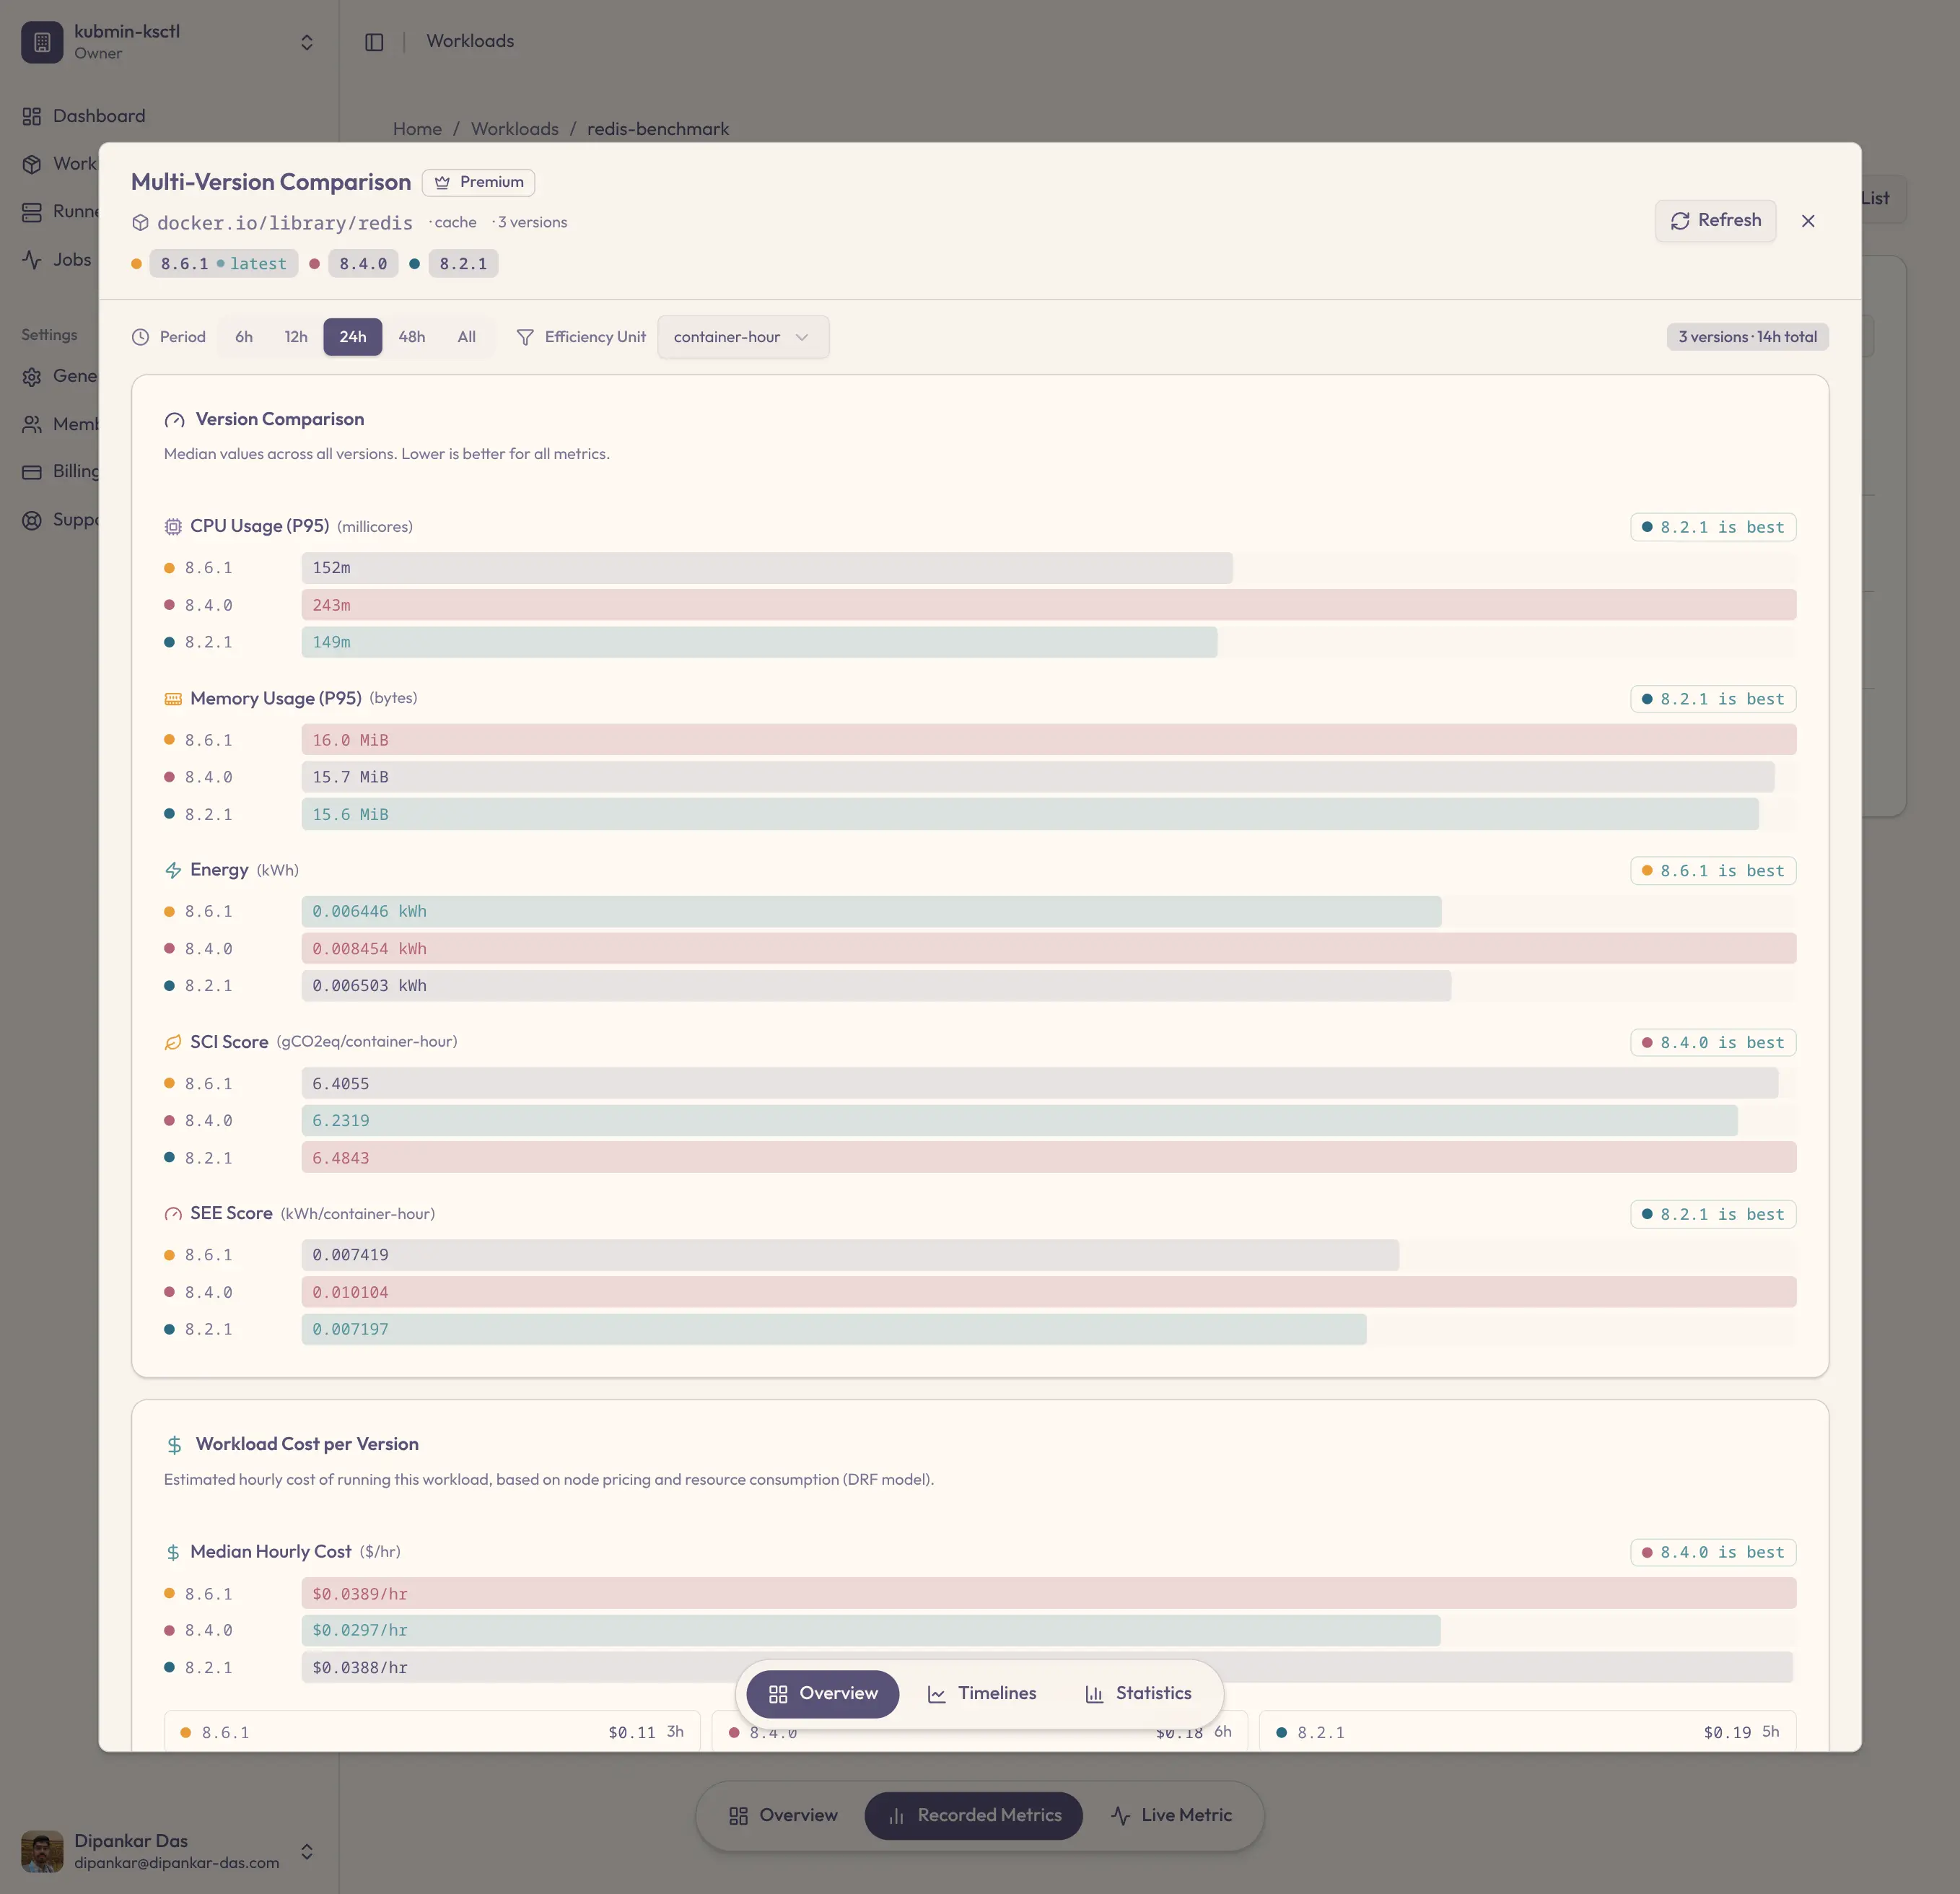
8.4.0 uses 87.8% CPU but isn't the most expensive. 8.2.1 uses 51.2% CPU but costs more. No single metric tells the full story — you need cost, energy, and efficiency together. That's what kubmin gives you.
This is one workload. Imagine what kubmin finds across your entire cluster.
Try It On Your WorkloadsEach capability ships standalone. Together they form a unified ledger — cost, energy, and efficiency, per workload, per release.
Point kubmin at a specific image tag and get hourly SCI, energy consumption, CPU, memory, and cost — plus the full trend across that version's lifetime. Not generic pod metrics. Version-scoped visibility into what each build actually costs and consumes in production.
Compare any two image versions across CPU, memory, energy, SCI, SEE, and runtime cost — per functional unit of work. Ship a new release and see within hours whether it regressed 30% on efficiency, before the regression compounds into your bill.
Kubmin classifies each workload as CPU-bound, memory-bound, general, or resource-starved — automatically, from runtime behavior. Idle-time percentage and hourly heatmaps show exactly when waste spikes. No more right-sizing blind.
Spinning up a new cluster? Kubmin filters instance types against your workload profile and shows spec, hourly cost, and embodied carbon for each option. Region picker surfaces real grid carbon intensity and % renewable energy — so cluster decisions are informed, not guessed.
Running on the default instance type in us-east-1? Kubmin surfaces alternative instance types with similar or better performance at lower cost, plus alternative regions that cut your workload's running cost and run on a cleaner grid. Side-by-side tradeoffs, not guesswork.
Kubmin turns every finding — idle replicas, overprovisioned limits, cheaper instance types, greener regions — into a ranked action list with estimated monthly cost savings and efficiency gains attached. Each wins ships with a copy-paste kubectl command. Open the dashboard, act on the top three.
Dollar-ranked actions, not alertsA workload can show 40% CPU utilization and still be wasting energy. How? Polling loops, idle connections, inefficient memory access patterns — they all consume power without producing value. Traditional monitoring tools see 40% busy and move on. Kubmin sees the full picture — CPU usage alongside actual energy consumption over time — so you can spot the workloads where high utilization doesn't mean productive utilization.
Kubmin uses Kepler — a CNCF project — to estimate energy consumption at the container level. Kepler uses kernel-level instrumentation and ML-based models to attribute power usage per container, even in cloud environments where hardware counters aren't directly accessible.
In cloud environments, energy measurements are estimates based on ML models trained on real hardware data. They're highly reliable for relative comparison and trend analysis — which is exactly what kubmin needs. The patterns matter more than the absolute numbers.
Sign up at kubmin.ksctl.com and create your Kubernetes cluster from the dashboard. Kubmin provisions the full monitoring stack automatically — Prometheus, Kepler, and the kubmin agent. You don't install anything manually.
Add one label and one annotation to the Deployments, StatefulSets, or DaemonSets you want to monitor. The dashboard shows you exactly what to add. That's the only configuration you do.
Kubmin aggregates data hourly and surfaces waste analysis, efficiency grades, cost breakdowns, and Quick Wins automatically. Open the dashboard and start saving.
Currently, clusters are created via ksctl. Support for importing existing clusters is coming soon.
We don't replace your monitoring stack. We see what your monitoring stack can't.
| vs A AWS Cost Explorer | vs B Kubecost | vs C Prometheus + Grafana | us kubmin | |
|---|---|---|---|---|
| 01 Per-container cost tracking | EC2 only | Est. | Manual | Yes |
| 02 Energy consumption per workload | Yes | |||
| 03 Idle workload detection | Basic | Manual | Auto | |
| 04 Deployment version comparison | Yes | |||
| 05 SCI + SEE sustainability scoring | Yes | |||
| 06 Regional cost comparison | Partial | Yes | ||
| 07 Ready-to-use kubectl fixes | Yes | |||
| 08 Instance type optimization | Yes | |||
| 09 Setup time | N/A | ~30 min | Hours/Days | ~10 min |
Kubmin doesn't replace your monitoring stack. It sees what your monitoring stack can't — the energy layer that drives real waste.
Fixed monthly pricing. No per-node fees. No surprise bills. All plans include auto-deployed Prometheus, Kepler, and Grafana.
No hidden fees · Cancel anytime · All plans include Prometheus & Grafana
Energy measurement powered by Kepler — kernel-level container energy attribution
SCI-aligned sustainability scoring built on the GSF specification
Cluster management powered by ksctl — fully open source on GitHub
Sign up free. Connect a cluster. See your waste in minutes.
Honest answers, no marketing fluff. If we don't have the answer here, ask in Discord.